

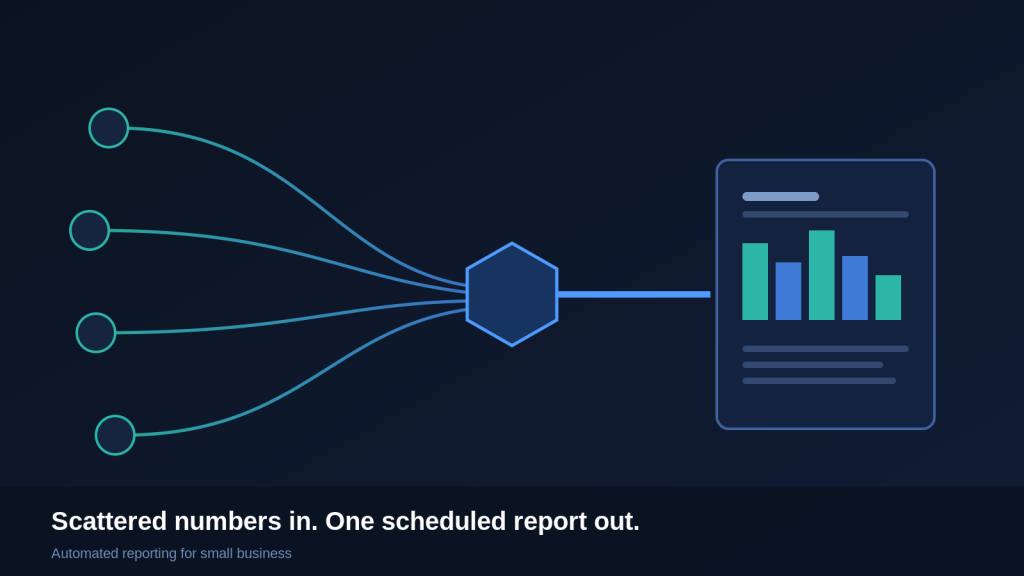
Most small businesses do not have a reporting problem. They have a re-typing problem. Someone exports a sales total, pastes it into a spreadsheet, pulls a number off the invoicing tool, copies last week’s figures down a row, and emails the result to the owner every Monday. Automated reporting for small business replaces that weekly ritual with a system that gathers the numbers, formats them the same way every time, and delivers them on schedule without anyone touching a keyboard.
This guide is about the workflow, not a single product. It covers which report to automate first, how the pieces fit together, the failure modes that quietly waste the effort, and the cases where automation is the wrong call. The goal is an owned reporting system that runs on its own, not another subscription that produces a dashboard nobody opens.
What automated reporting for small business actually means
Automated reporting for small business is a system that pulls numbers from the tools you already run, applies the same calculations every cycle, and sends a finished report to the people who need it on a fixed schedule. No manual export, no copy-paste, no reformatting.
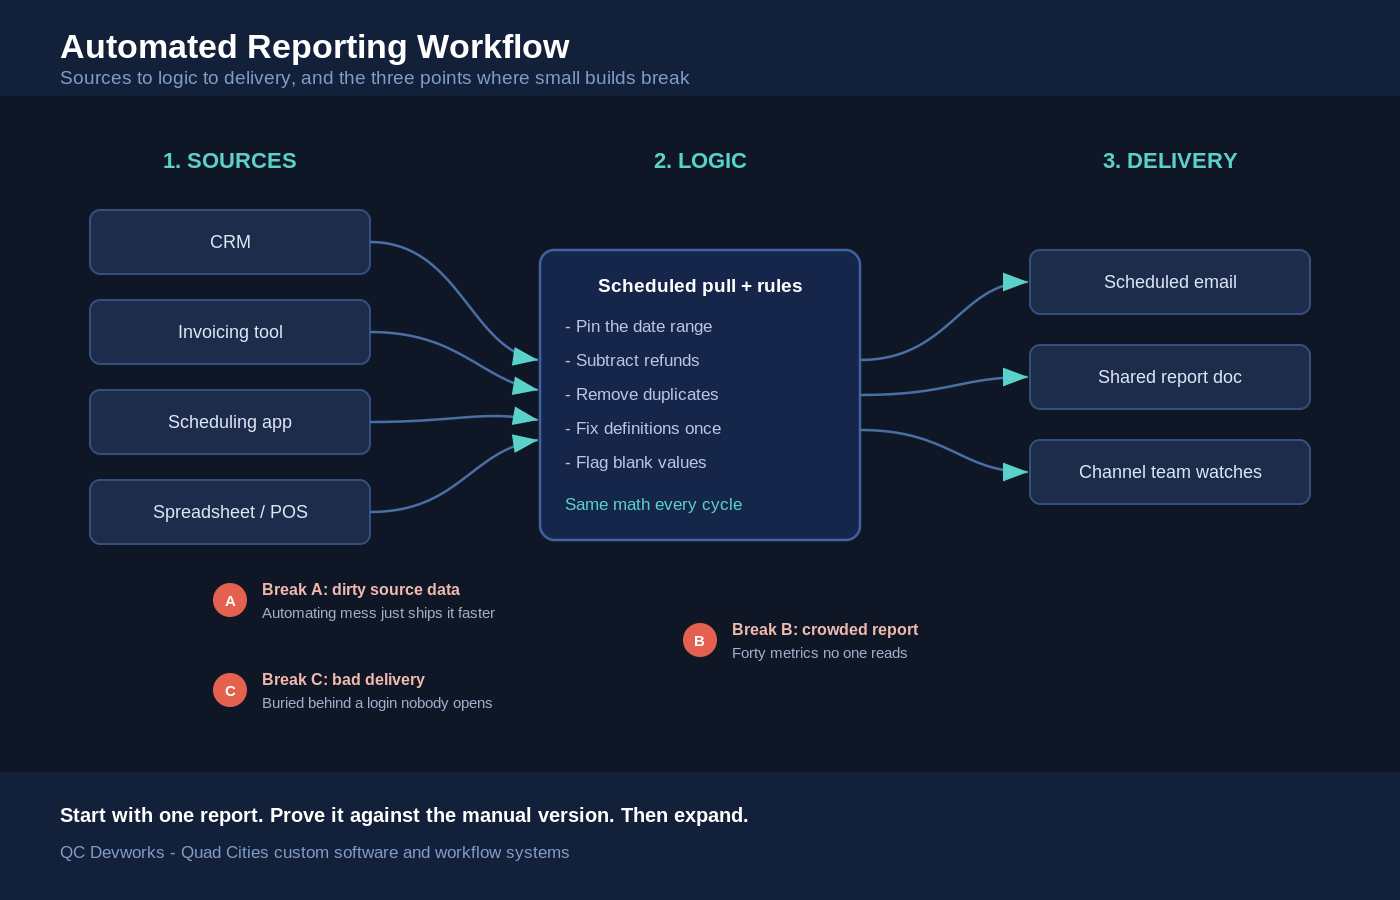
The work breaks into four moving parts. A source is wherever the number lives now: the CRM, the invoicing tool, a scheduling app, a spreadsheet, or the point-of-sale system. A pull is the scheduled step that reads each source. The logic is the set of filters and math that turns raw rows into the figure you trust, such as revenue booked this week minus refunds. Delivery is how the finished report reaches a person, usually a scheduled email, a shared document, or a message in the tool your team already watches.
The reason this matters for a small operation is simple. The owner or office manager is usually the one doing the manual version, and that person is the most expensive set of hands to spend on copy-paste. Industry estimates put manual reporting at well over ten hours a week for teams that live in spreadsheets, as of June 2026, according to reporting-tool vendors tracking the problem. Even at a fraction of that, the hours add up fast when one person owns the whole cycle.
Manual report vs owned reporting system
The difference between a manual report and an owned reporting system is who does the work and whether the output stays consistent when the person doing it is busy, sick, or gone.
A manual report depends on a human remembering the steps in order. It produces a number that is only as reliable as that person’s attention on a given Monday. When they take vacation, the report skips a week. When they leave, the knowledge of which columns to filter leaves with them. The format drifts because each person formats a little differently.
An owned reporting system encodes the steps once. The filters, the date ranges, and the math live in the system, not in someone’s memory. The report comes out identical every cycle, arrives on time whether or not anyone is at their desk, and keeps a record you can look back on. The trade is real work up front to define the logic and connect the sources. The payoff is that the cost is paid once instead of every single week.
This is the same build-versus-rent decision that runs through every operations tool, and it is worth weighing honestly before you commit. Our guide on choosing a custom internal tool over another SaaS subscription walks through where each side wins.
Which report to automate first
Automate the report that is pulled most often, takes the most manual steps, and drives an actual decision. Frequency times effort times consequence tells you where the payback is largest.
Run a short audit before building anything. List every recurring report someone produces by hand. For each one, write down four things: how often it goes out, how many minutes it takes to assemble, how many separate tools the numbers come from, and what decision it informs. A weekly sales-and-cash summary that pulls from three systems and takes forty minutes is a far better first target than a quarterly report that takes an hour but only runs four times a year.
Be wary of the report that is easy to automate but changes nothing. If a number gets compiled every week and no one acts on it, automating it just makes a useless artifact arrive faster. The strongest first candidate is a report the owner actually reads to make a call: are we ahead or behind on revenue, is anything stuck, who do we need to chase. Reports that pull from many disconnected tools also tend to deliver the biggest relief, because the manual version of stitching several systems together is exactly the part people dread. If your numbers are scattered, our guide on connecting business software that does not talk to each other covers the integration side of the problem.
How the pieces of an automated report fit together
An automated report connects sources to logic to delivery in a fixed sequence, and each connection point is where small builds succeed or fail. Understanding the chain helps you scope the work honestly.
Start at the sources. Every tool that holds a number you need has to be reachable on a schedule, either through a direct connection, an export it can produce automatically, or a shared sheet it writes to. The fewer manual exports in this layer, the more reliable the whole system. Next comes the logic layer, where raw rows become trusted figures. This is where date ranges get pinned down, refunds get subtracted, duplicates get removed, and definitions get fixed so that revenue means the same thing every week. The delivery layer then takes the finished figures and puts them where the reader already looks. A report that lands in an inbox the owner checks every morning gets read. A dashboard buried behind a login the owner forgets gets ignored.
The visual below maps the flow and marks the three points where small-business reporting builds most often break.
The failure modes that waste the effort
Most automated reports fail for boring reasons: the data underneath is messy, the report is too crowded to read, or it lands somewhere no one looks. None of these are exotic, and all three are avoidable if you plan for them.
The first failure is dirty source data. If the same customer is entered three ways, or a deal stage is left blank half the time, the report automates the mess instead of fixing it. Clean the inputs before you build, and add a simple check that flags blank or impossible values so a bad number does not quietly ship. The second failure is the crowded report. A page with forty metrics is a page nobody reads. Pick the handful of numbers tied to a decision and cut the rest. The third failure is bad delivery. A report that requires logging into yet another tool competes with everything else on a busy day. Push the finished report into the channel the reader already watches, and it gets seen.
There is a fourth, quieter failure: the report that runs forever after the question behind it stopped mattering. Schedule a review every couple of months. Kill the reports no one opens, and adjust the ones whose definitions have drifted. An owned system is only worth owning if it stays pointed at real questions.
When automated reporting is the wrong move
Automated reporting is the wrong move when the report changes shape every time, when the data is too unreliable to trust, or when the manual version takes five minutes and runs rarely. Automation rewards repetition, not one-offs.
A report that gets redefined constantly is a poor automation target, because you would rebuild the logic as often as you run it. Exploratory questions that you ask once and never again belong in a manual pull or a quick conversation with whoever knows the data. And if the underlying numbers are not yet trustworthy, automating them only spreads bad figures faster and with more authority. Fix the data source first. The honest test is whether the report is stable, repeated, and decision-driving. If it is not all three, the manual version may still be the right tool, and forcing automation just adds a system to maintain for no real return.
Scoping an automated reporting build
Scope an automated reporting build by starting with one report, proving it end to end, and expanding only after it has run clean for a few cycles. A narrow first build de-risks the whole effort.
Pick the single report that won the audit. Map its sources, write down the exact filters and math, and decide the schedule and the delivery channel. Build that one path, watch it run for several cycles against the manual version, and confirm the numbers match before you trust it alone. Only then add the second report. This staged approach keeps the build understandable, surfaces data problems early on a small surface, and means the first win arrives in days rather than after a months-long platform rollout.
Reporting rarely sits on its own for long. Once the numbers flow reliably, the same source connections often feed a live view the owner can check any time, which is the natural next step. Our guides on what belongs in an operations dashboard and the broader workflow systems we build cover where reporting connects to the rest of the operation.
Reporting as the start of owner visibility
A reliable report is the first piece of owner visibility, and visibility is what lets an owner step back from the day-to-day without losing the thread. When the right numbers arrive on their own, the owner stops being the bottleneck who has to assemble them.
That is the real return on automated reporting for small business. The hours saved are nice, but the bigger gain is consistency and reach: the same numbers, the same way, every cycle, in front of the person who needs them, whether or not anyone remembered to build the report by hand. Start with one report that drives a real decision, prove it, and grow the system from there. If you want help mapping your recurring reports and deciding which to automate first, a free operations audit is a practical place to begin.